| Performance Report | AC | |||
| Configuration | SKU4-1(A6) | |||
| OS | Windows 11 pro 24H2 26100.2314 | |||
| RESOLUTION(default) | 1920*1080 | |||
| CPU | AMD Ryzen 7 6800H with Radeon Graphics | |||
| RAM | 32GB | |||
| SSD | Lexar SSD NQ780 1TB | |||
| LCD | HKC LCD Display(Model:2316) | |||
| WIFI | Realtek 8852BE Wireless LAN WiFi 6 PCI-E NIC 2024/3/19 6001.15.151.0 |
|||
| BT | Realtek Bluetooth Adapter 2024/2/2 1.1067.2401.502 |
|||
| BIOS/EC | BIOS:2.38,12/17/2024 EC:0.36 | |||
| Preload | ||||
| 3Dmark11 report (v_105) | 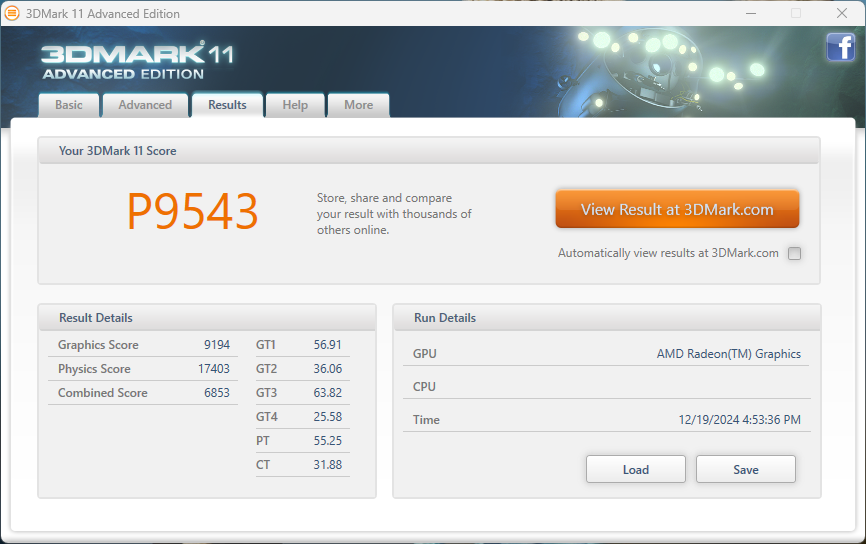 |
|||
| 3DMark 11 Score | P9543 | |||
| Graphics Score | 9194 | |||
| Physics Score | 17403 | |||
| Combined Score | 6853 | |||
| 3DMark 2-2-8217 | 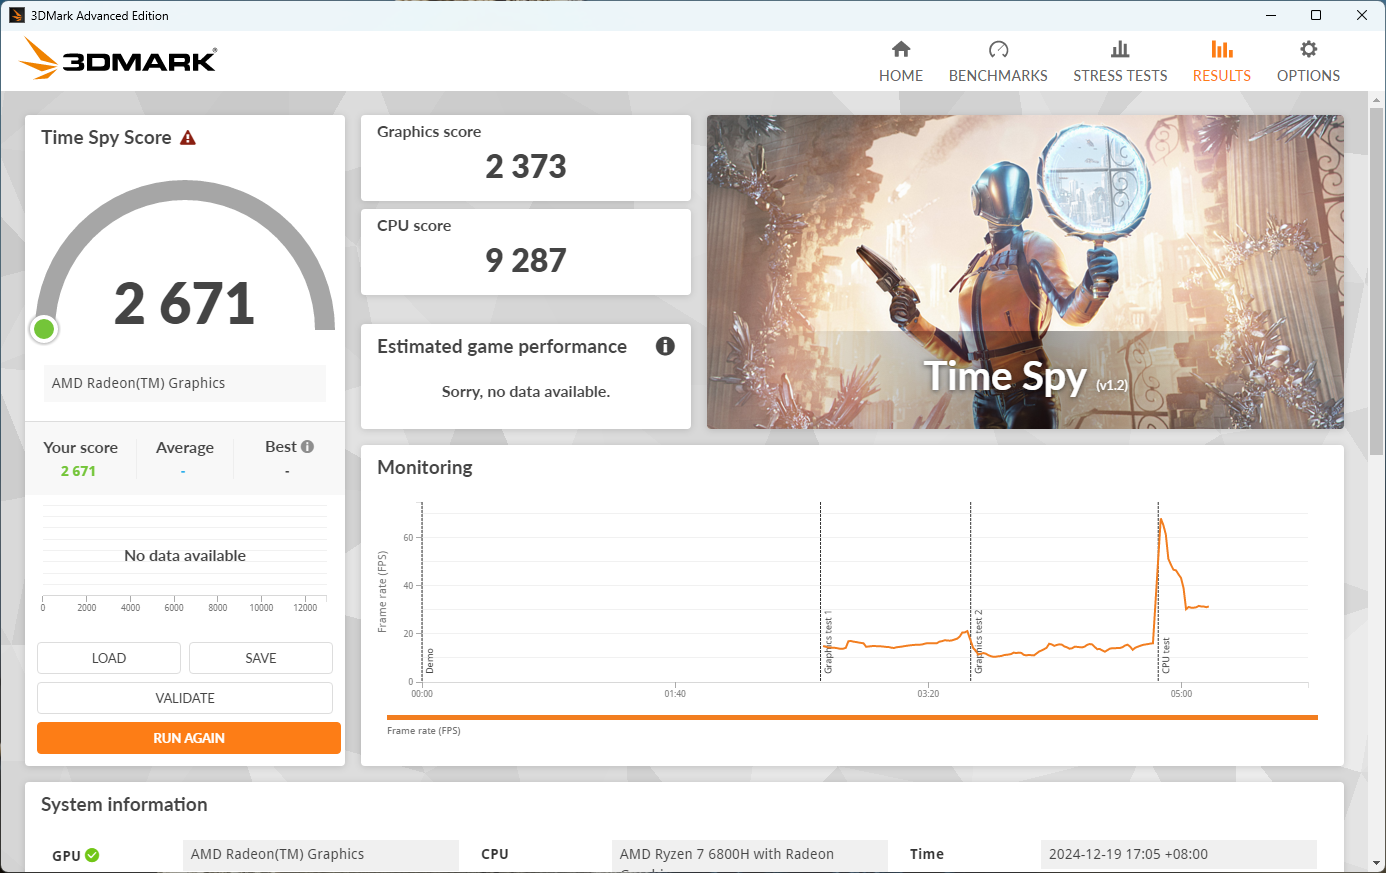 |
|||
| 3DMark-Time Spy | ||||
| 3DMark: Time Spy | 2671 | |||
| Graphics Score | 2373 | |||
| CPU Score | 9287 | |||
| 3DMark-Fire Strike | 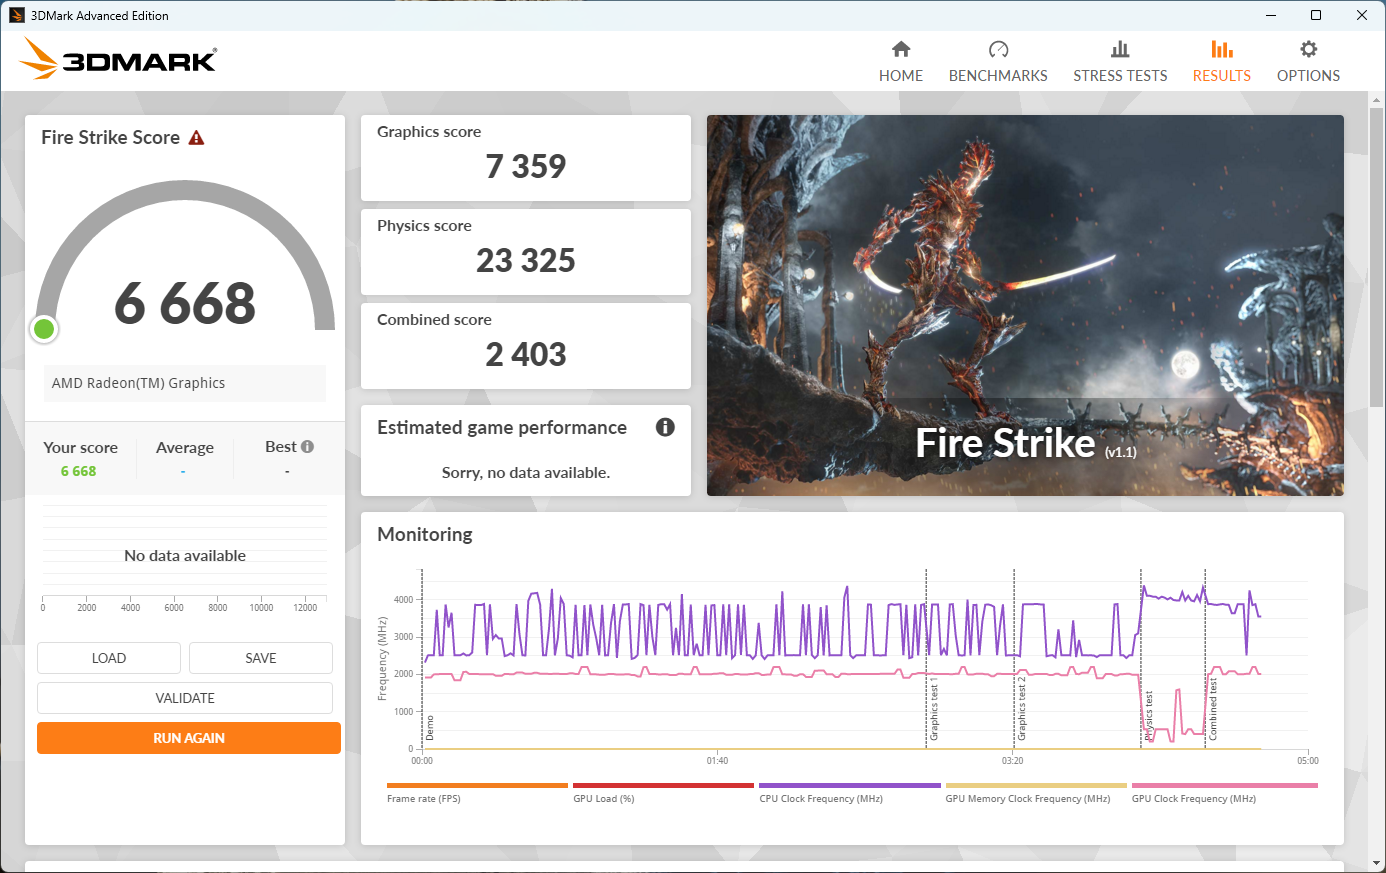 |
|||
| 3DMark: Fire Strike | 6668 | |||
| Graphics Score | 7359 | |||
| Physics Score | 23325 | |||
| Combined Score | 2403 | |||
| CPU Profile | 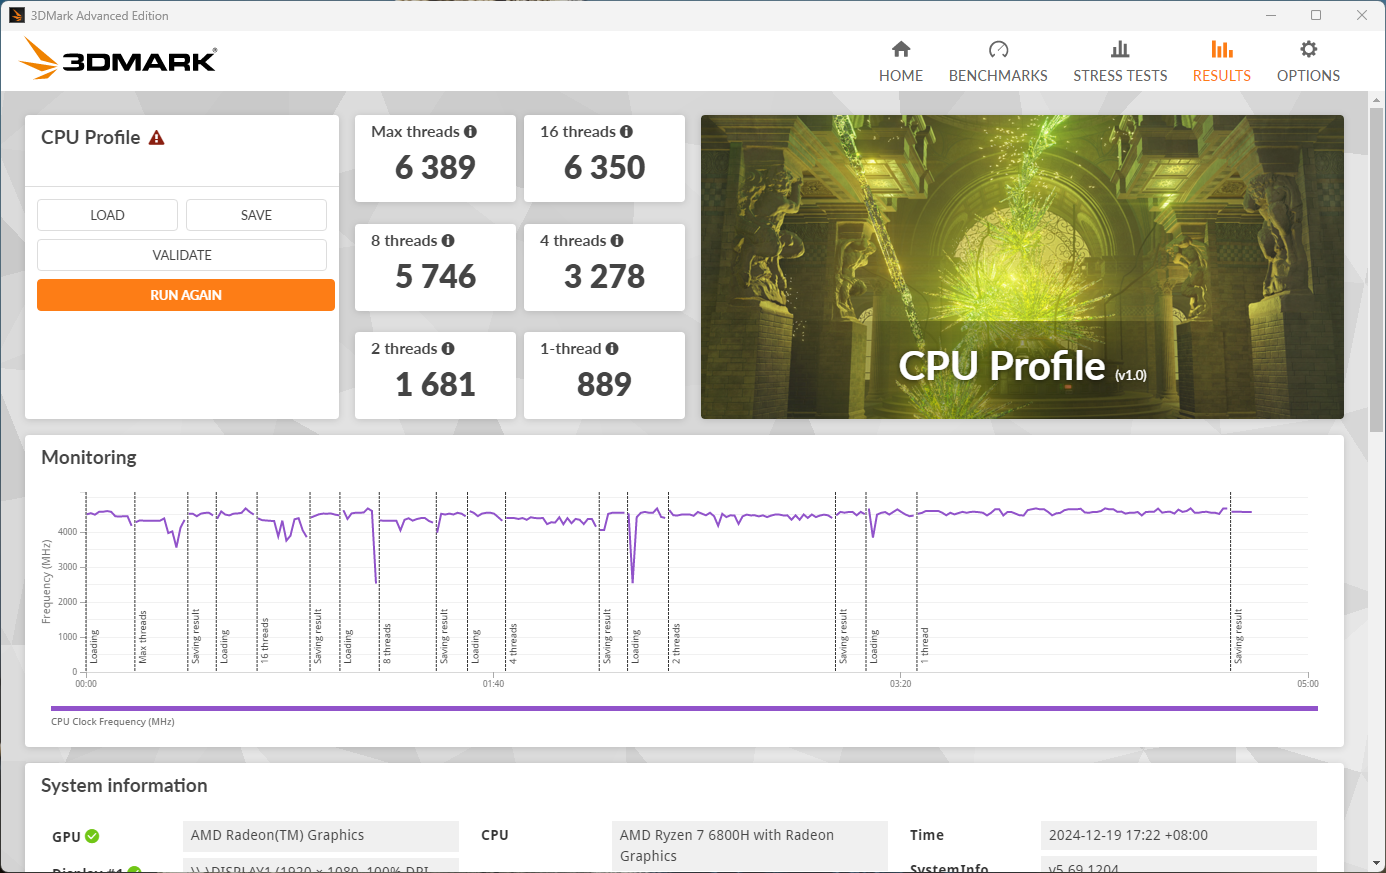 |
|||
| Max threads | 6389 | |||
| 16 threads | 6350 | |||
| 8 threads | 5746 | |||
| 4 threads | 3278 | |||
| 2 threads | 1681 | |||
| 1-thread | 889 | |||
| 3DMark-Cloud Gate | 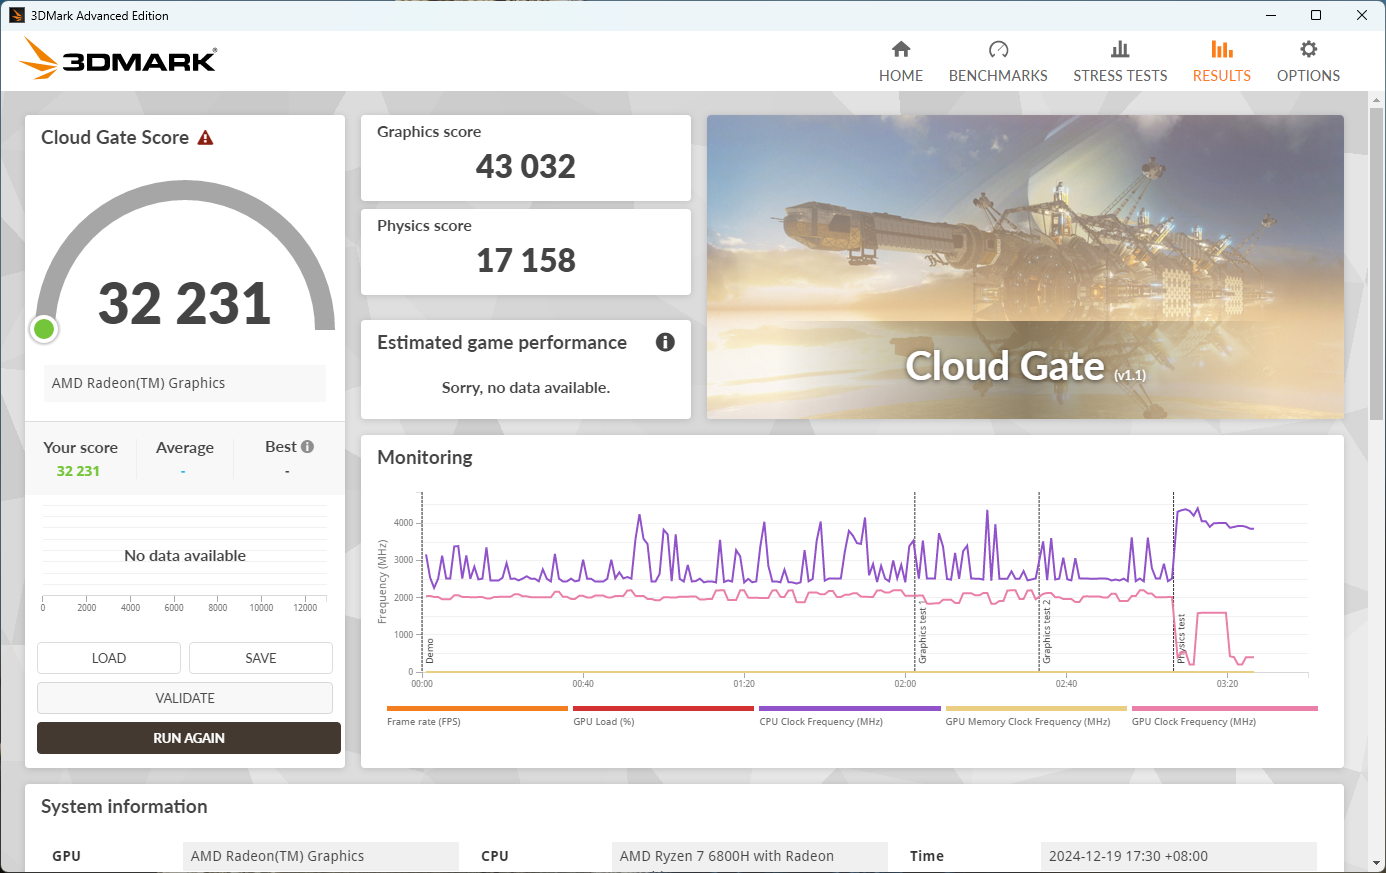 |
|||
| 3DMark: Cloud Gate | 32231 | |||
| Graphics Score | 43032 | |||
| Physics Score | 17158 | |||
| 3DMark-Ice Storm | 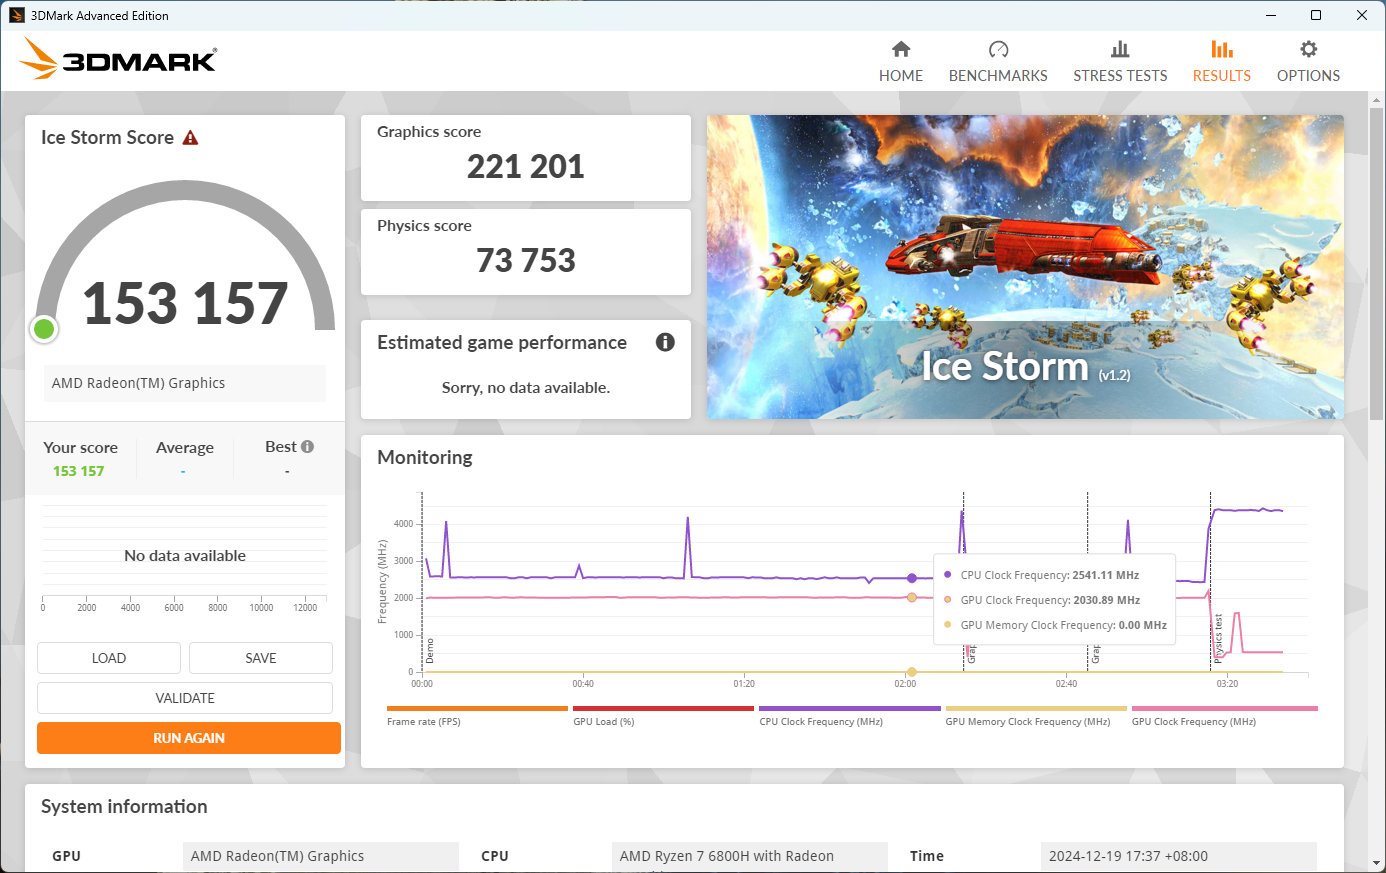 |
|||
| 3DMark: Ice Storm | 153157 | |||
| Graphics Score | 221201 | |||
| Physics Score | 73753 | |||
| CINEBENCH R24 | 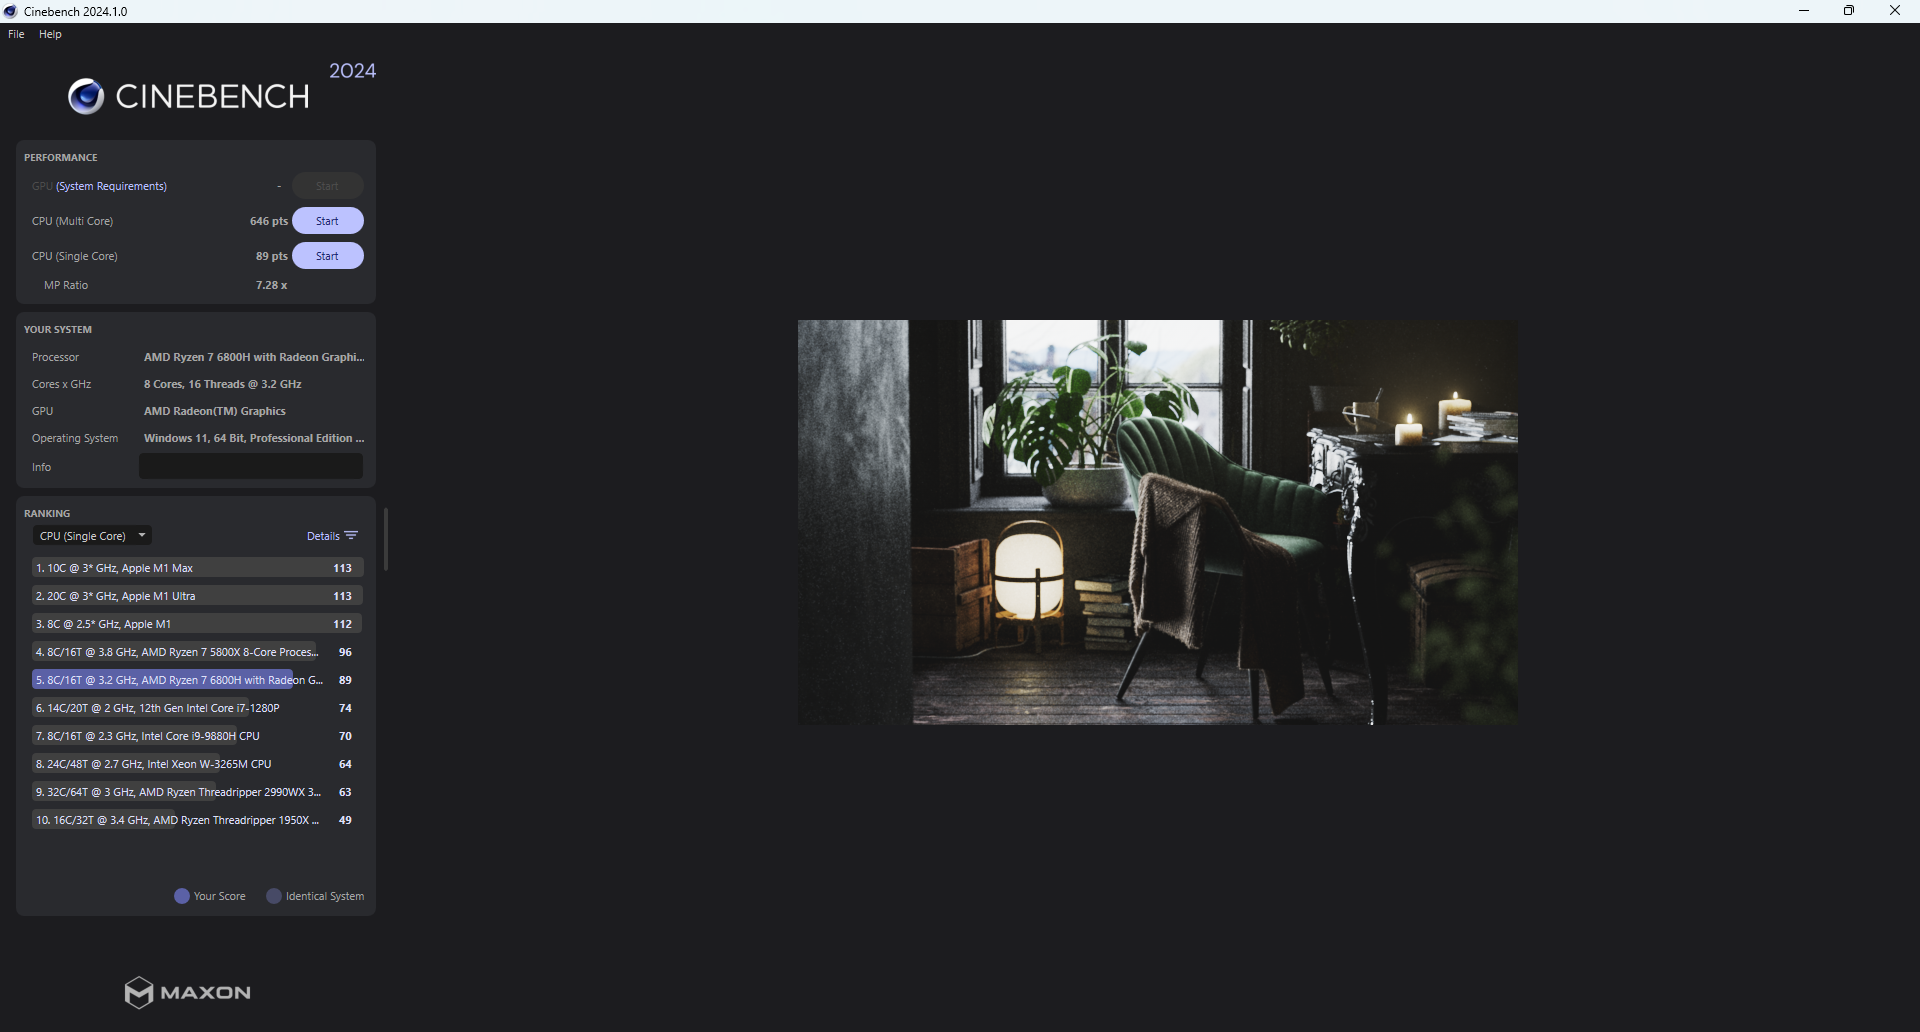 |
|||
| CPU(Multi Core) | 646pts | |||
| CPU(Single Core) | 89pts | |||
| MP Ratio | 7.28x | |||
| Furmark 64.2.4.3.0 | 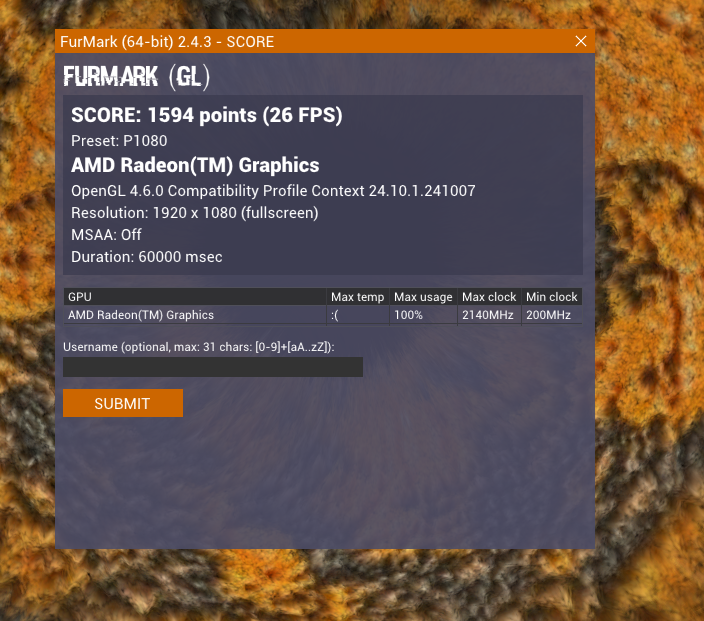 |
|||
| Graphics FPS | 1594points(26FPS) | |||
| PC Mark 10 (1-1-1761) | 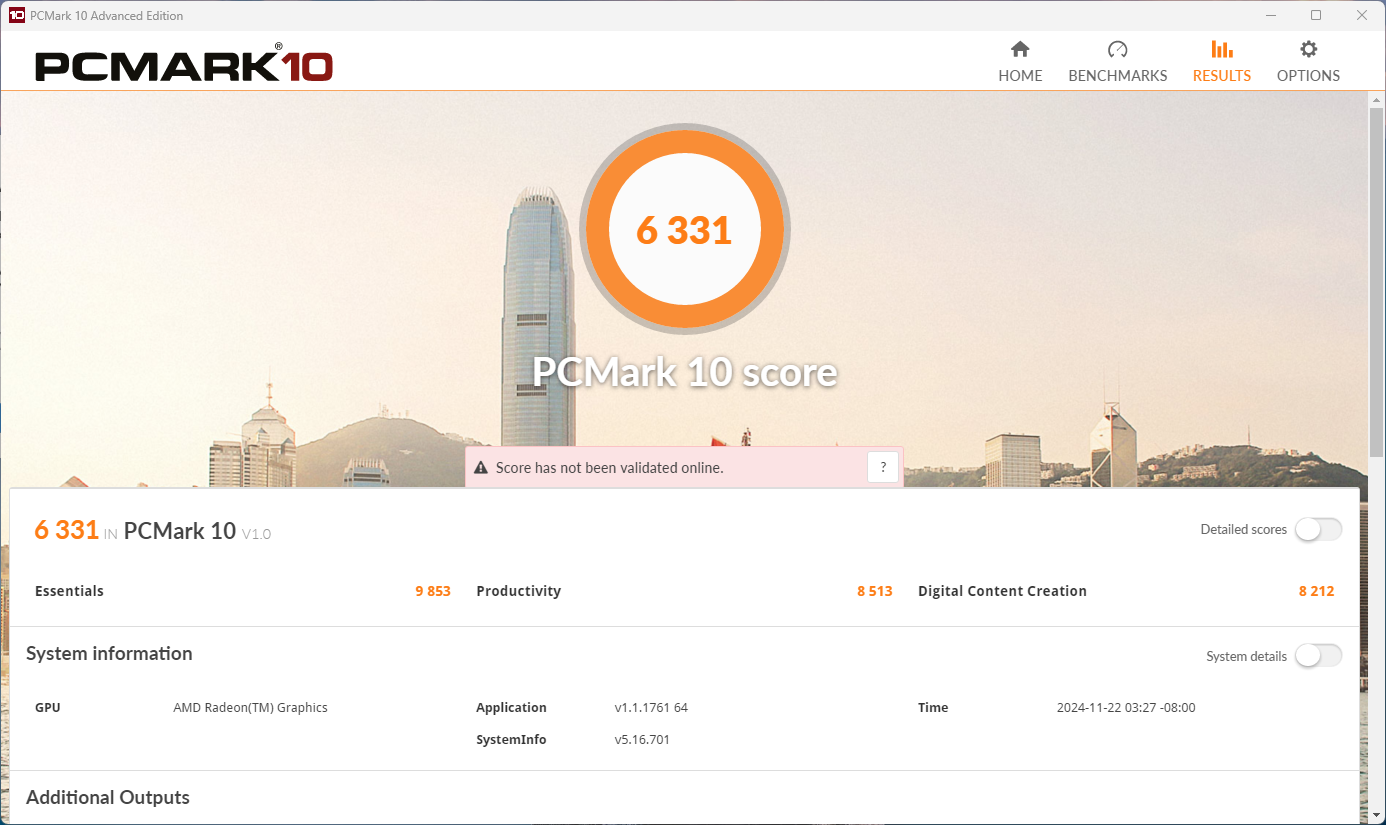 |
|||
| PC MARK 10 Score | 6331 | |||
| Essentials | 9853 | |||
| Productivity | 8513 | |||
| Digital Content Creation | 8212 | |||
| Performance Test(11.0) | 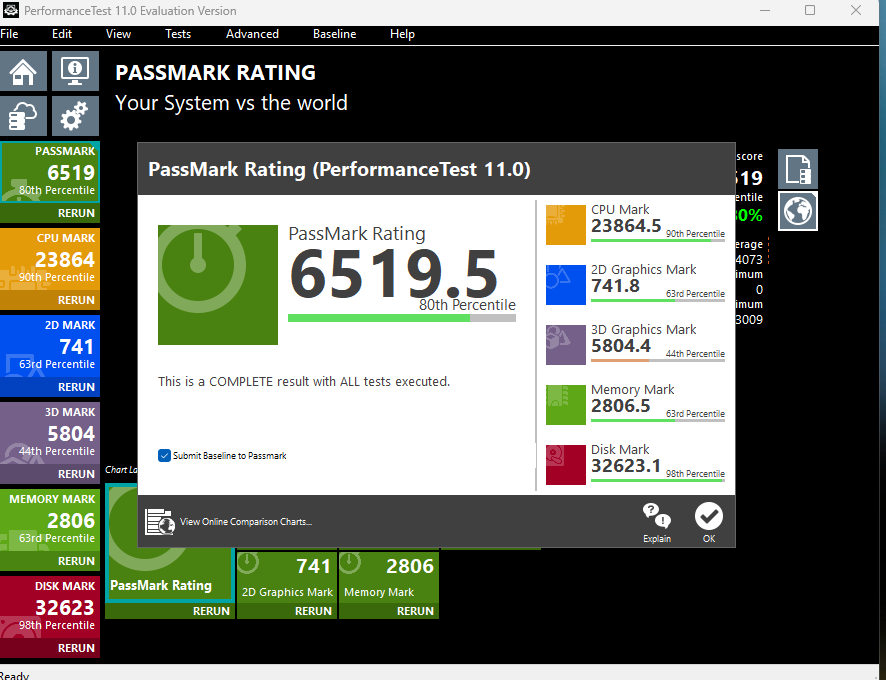 |
|||
| PassMark Rating | 6519.5 | |||
| CPU Mark | 23864.5 | |||
| 2D Graphics Mark | 741.8 | |||
| 3D Graphics Mark | 5804.4 | |||
| Memory Mark | 2806.5 | |||
| Disk Mark | 32623.1 | |||
| CrystalDiskMark | |||||
| Tester | Jiang Wencan | ||||
| Test Data | 2024/12/19 | ||||
| Test Tool | Crystal Disk Mark | ||||
| Test Tool Version | 8.0.4 | ||||
| Test Project | NUCRB02 | ||||
| Test SKU | SKU4-1(A6) | ||||
| OS | Windows 11 pro 24H2 26100.2314 | ||||
| BIOS/EC | BIOS: LLC.2.38,12/17/2024(A6) EC:0.36 |
||||
| USB 3.1Model | UGREEN 3.1 Mobile HDD | ||||
| Type-C Model | UGREEN 3.1 Mobile HDD/ORICO 4.0 Solid state disk(Model:MTQ-40G) | ||||
| Data Record | SKU4-1 | ||||
| Port | Times | Record | USB3.1 Device | ||
| Read【MB/S】 | Write【MB/S】 | ||||
| USB3.1 Port1(Left) | 5 | SEQ1M Q8T1 | 957.76 | 966.97 | 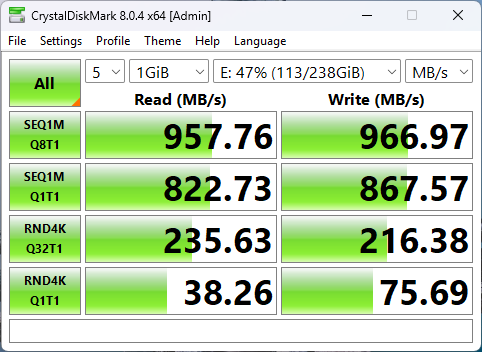 |
| SEQ1M Q1T1 | 822.73 | 867.57 | |||
| RND4K Q32T1 | 235.63 | 216.38 | |||
| RND4K Q1T1 | 38.26 | 75.69 |
| USB3.1 Port2(Right) | 5 | SEQ1M Q8T1 | 952.14 | 962.94 | 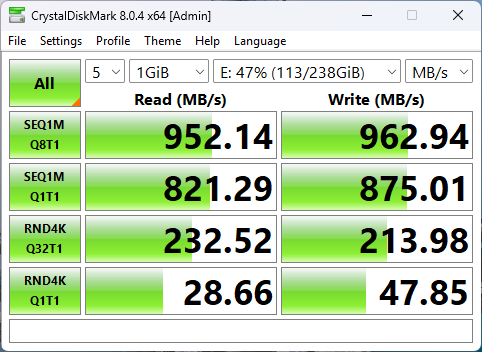 |
| SEQ1M Q1T1 | 821.29 | 875.01 | |||
| RND4K Q32T1 | 232.52 | 213.98 | |||
| RND4K Q1T1 | 28.66 | 47.85 |
| USB3.1(up) | 5 | SEQ1M Q8T1 | 940.01 | 918.10 | 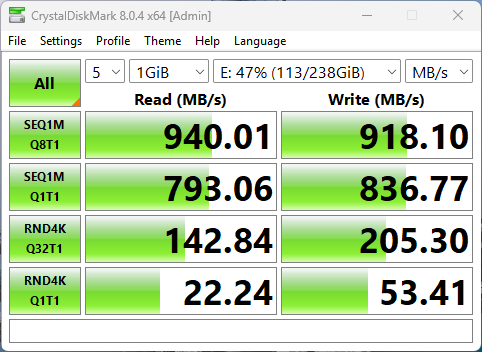 |
| SEQ1M Q1T1 | 793.06 | 836.77 | |||
| RND4K Q32T1 | 142.84 | 205.30 | |||
| RND4K Q1T1 | 22.24 | 53.41 |
| USB2.0(down) | 5 | SEQ1M Q8T1 | 40.66 | 35.42 | 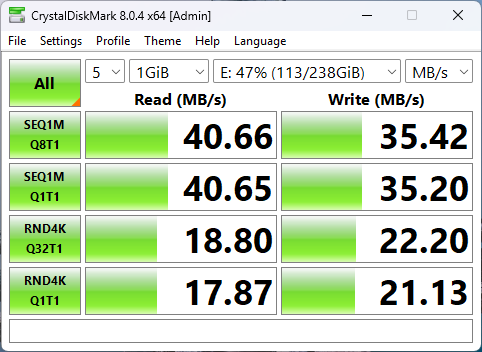 |
| SEQ1M Q1T1 | 40.65 | 35.20 | |||
| RND4K Q32T1 | 18.80 | 22.20 | |||
| RND4K Q1T1 | 17.87 | 21.13 |
|
Type-C front (Near the power button) |
5 | SEQ1M Q8T1 | 3154.31 | 1641.49 | 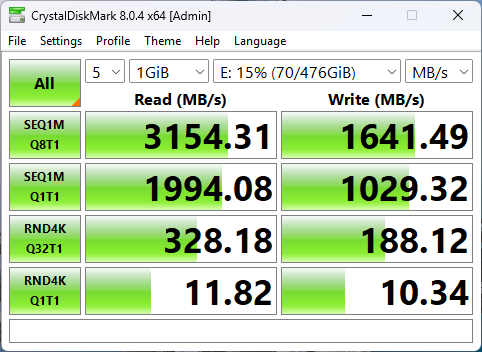 |
| SEQ1M Q1T1 | 1994.08 | 1029.32 | |||
| RND4K Q32T1 | 328.18 | 188.12 | |||
| RND4K Q1T1 | 11.82 | 10.34 |
|
Type-C behind (Near the power button) |
5 | SEQ1M Q8T1 | 3158.32 | 1613.08 | 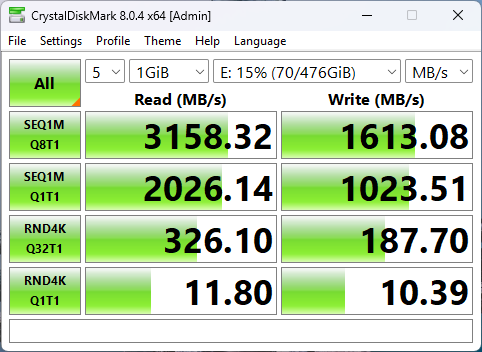 |
| SEQ1M Q1T1 | 2026.14 | 1023.51 | |||
| RND4K Q32T1 | 326.10 | 187.70 | |||
| RND4K Q1T1 | 11.80 | 10.39 |
|
Type-C front (Near the USB port) |
5 | SEQ1M Q8T1 | 938.36 | 918.21 | 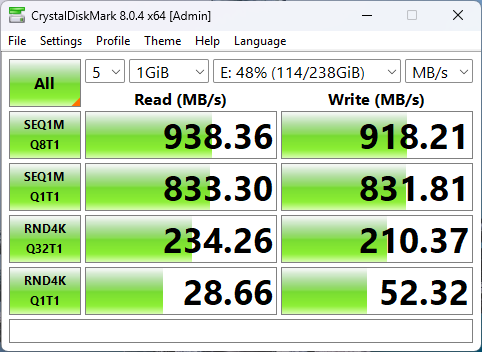 |
| SEQ1M Q1T1 | 833.30 | 831.81 | |||
| RND4K Q32T1 | 234.26 | 210.37 | |||
| RND4K Q1T1 | 28.66 | 52.32 |
|
Type-C behind (Neart the USB port) |
5 | SEQ1M Q8T1 | 931.26 | 914.56 | 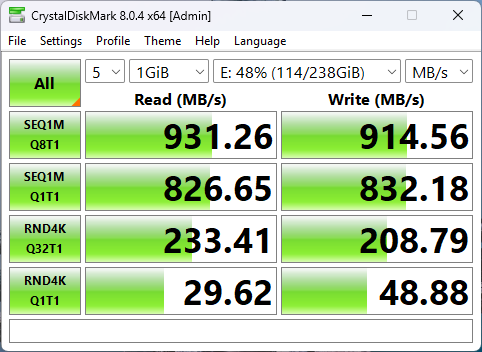 |
| SEQ1M Q1T1 | 826.65 | 832.18 | |||
| RND4K Q32T1 | 233.41 | 208.79 | |||
| RND4K Q1T1 | 29.62 | 48.88 |
| Port | Times | Record | SSD | ||
| Read【MB/S】 | Write【MB/S】 | ||||
| SSD-Internal | 5 | SEQ1M Q8T1 | 6514.70 | 2798.07 | 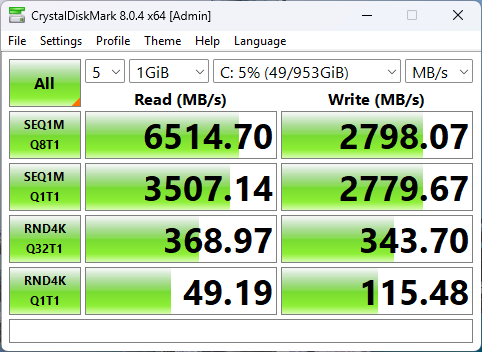 |
| SEQ1M Q1T1 | 3507.14 | 2779.67 | |||
| RND4K Q32T1 | 368.97 | 343.70 | |||
| RND4K Q1T1 | 49.19 | 115.48 | |||
| Port | Times | Record | TF | ||
| Read【MB/S】 | Write【MB/S】 | ||||
| SD(TF) | 5 | SEQ1M Q8T1 | 195.81 | 168.38 | 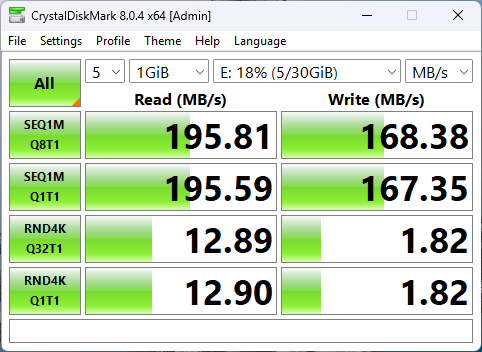 |
| SEQ1M Q1T1 | 195.59 | 167.35 | |||
| RND4K Q32T1 | 12.89 | 1.82 | |||
| RND4K Q1T1 | 12.90 | 1.82 | |||
| BIOS/EC: | |||
| Score | Average | ||
| Post time tool | SKU4-1 | ||
| BIOS time | 5.40 | 5.40 | |
| 5.40 | |||
| 5.40 | |||
| 5.40 | |||
| 5.40 | |||
| BIOS/EC: | |||
| Score | Average | ||
| S0 | SKU4-1 | ||
| Boot time(<30s) | 16.23 | 16.20 | |
| 16.24 | |||
| 16.35 | |||
| 16.27 | |||
| 15.90 | |||
| BIOS/EC: | |||
| Score | Average | ||
| S3 | SKU4-1 | ||
| S3 Resume time(<10s) | 3.63 | 3.63 | |
| 3.69 | |||
| 3.59 | |||
| 3.65 | |||
| 3.61 | |||
| BIOS/EC: | |||
| Score | Average | ||
| S4 | SKU4-1 | ||
| S4 Resume time(<30s) | 16.10 | 16.19 | |
| 16.27 | |||
| 16.25 | |||
| 16.23 | |||
| 16.09 | |||
| BIOS/EC: | |||
| Score | Average | ||
| Reboot times | SKU4-1 | ||
| Reboot | 27.85 | 27.75 | |
| 27.96 | |||
| 27.48 | |||
| 27.76 | |||
| 27.68 | |||