2024年11月6日更新
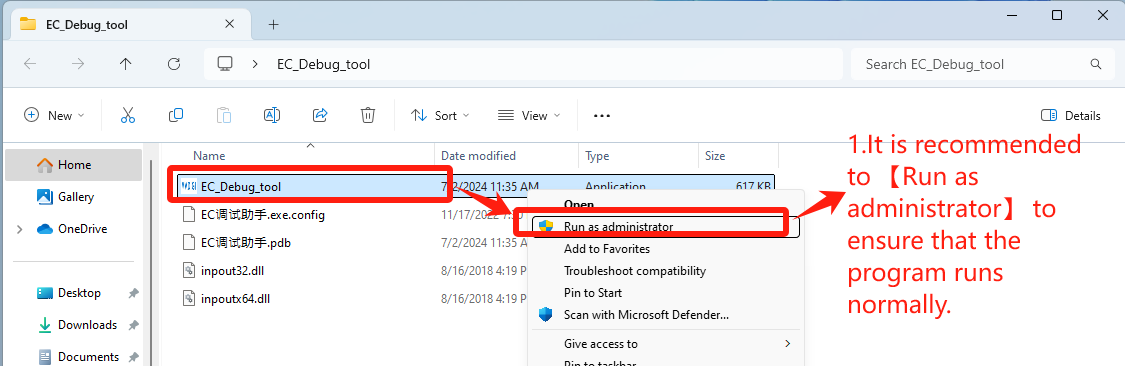
1. Double-click to open EC_Debug_tool
EC Tool Download: Click here
- It is recommended to 【Run as administrator】 to ensure that the program runs normally——Step1【Run as administrator】.
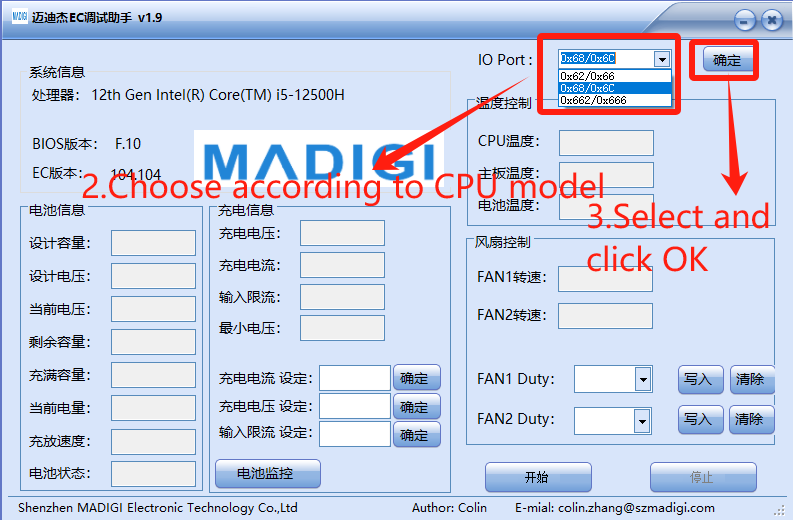
2. Set according to CPU brand
- Choose according to CPU model
- IO Port: Select 【0x62/0x66】for CPU Intel platform, click “OK”——Step3【确定】
- IO Port: Select 【0x662/0x666】 for CPU AMD platform, click “OK”——Step3【确定】
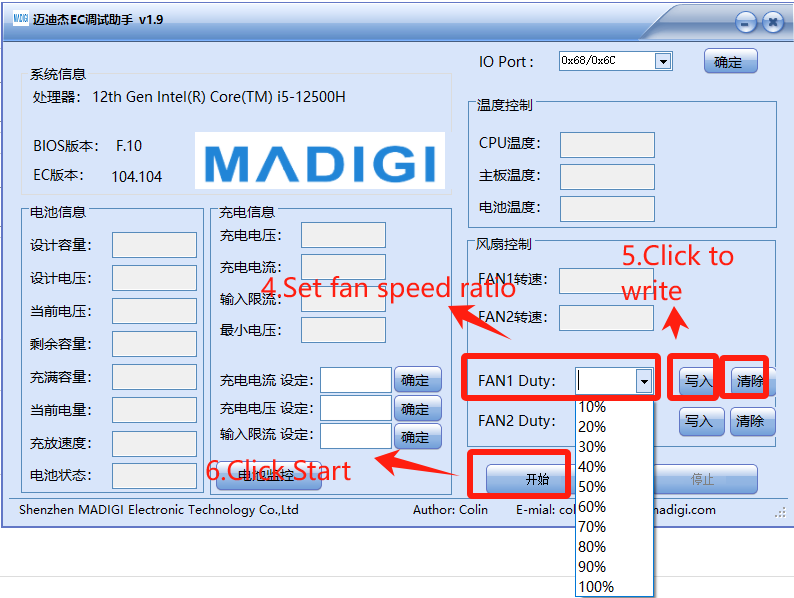
3. Set fan speed,just set in 【FAN1 Duty】
- Set fan speed ratio——Step4【FAN1 Duty】
- Click to write——Step5【写入】
- Click Start——Step6【开始】
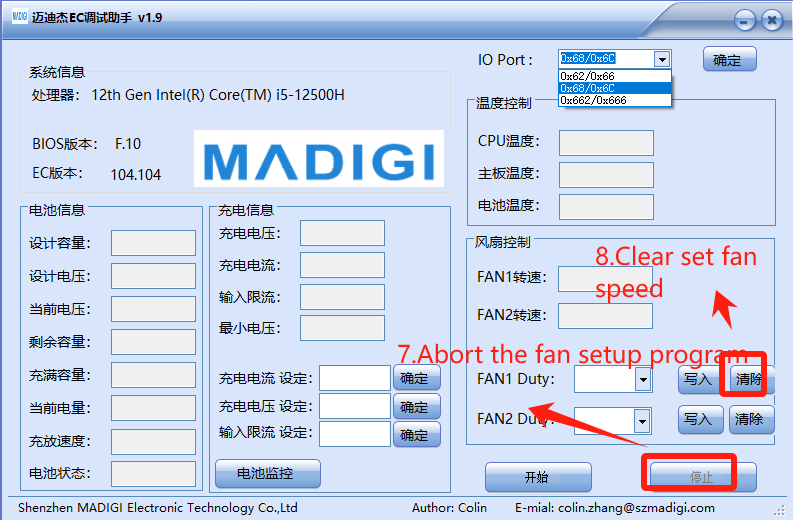
4. Clear settings and re-debug
- Abort the fan setup program——Step7【停止】
- Clear set fan speed——Step8【清除】
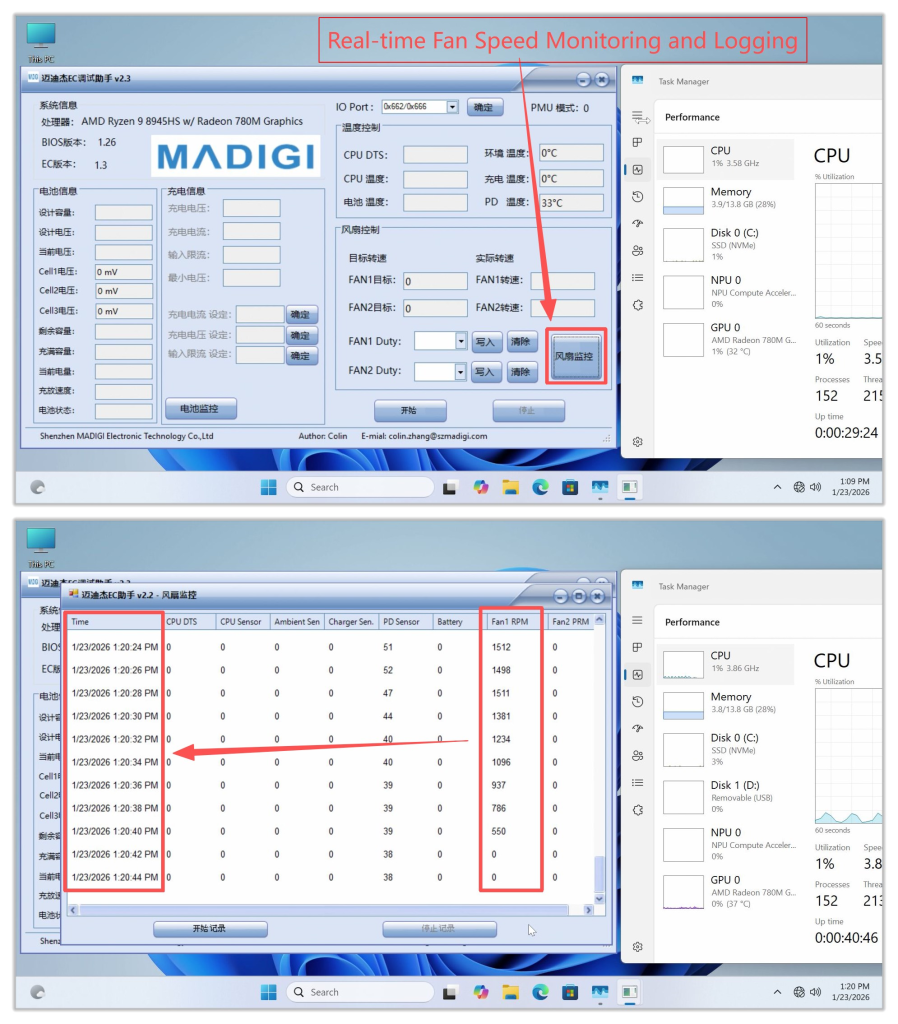
Other Features: Fan Speed Monitoring and Logging
- Clicking this button will display real‑time fan speed. If the fan speed is abnormal, you can take a screenshot and provide feedback to GEEKOM Engineers.
- It is recommended to open an additional Task Manager window and place it nearby to monitor hardware resource usage under different fan speeds. Generally, higher CPU usage leads to increased temperatures, which in turn causes the cooling fan speed to rise.
ご視聴ありがとうございます。間違いがありましたら、訂正をお願いします。